What a difference a year makes. In June 2014, oil and gas companies were benefiting from a remarkably stable three-year oil price of $96 per barrel for West Texas Intermediate (WTI). Few in the industry suspected that a collapse in oil prices was looming. Yet the next month, rising U.S. supply triggered the beginning of an oil price slide that accelerated dramatically when Saudi Arabia refused to cut production at the November OPEC meeting. The slide continued into 2015 dropping to $39 by August.
Faced with cash flow declines resulting from a 64% drop in oil prices and the prospects for a prolonged low-price environment, industry executives reevaluated projects and slashed capital expenditures. These spending cuts, while substantial, were necessary to preserve capital. As might be expected, the cuts will lead to declines in production. Ironically, it is this supply/demand imbalance that paves the way for the next rebound in prices. See chart below.
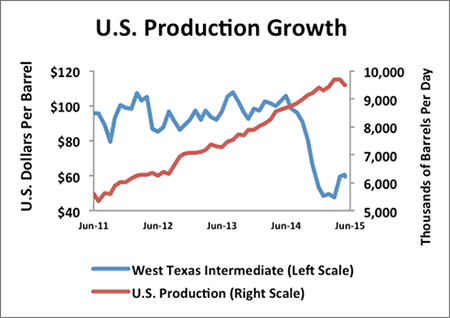
In hindsight, the decline in oil prices was the result of slowing demand growth and surging U.S. oil production. What surprised many was just how fast U.S. oil production grew. Thanks to advances in technology and new efficiencies, well productivity increased substantially, and U.S. production soared from 5.3 million barrels per day (mbpd) to 9.6 mbpd in five years, as reflected in the above graphic. During that time, a steady stream of capital flowed into the sector, due in large part to attractive returns, accelerating the production growth.
While the U.S. celebrated its new-found position as one of the world leaders in oil production, traditional suppliers of crude to U.S. markets were impacted. OPEC member countries, in particular, facing revenue erosion, were (and remain) unwilling to support a price that facilitated U.S. growth at their expense. Saudi Arabia, for instance, made the decision not to cut production in an effort to maintain market share and ride out the period of depressed prices. The country’s oil minister effectively allowed the market to determine the price for oil.
Unfortunately, the price set by the market went into freefall. Budgets based on higher prices required major adjustments. Though some companies initially delayed budget decisions pending confirmation of sustained lower prices, all oil companies have since cut spending at least once, with many making several adjustments.
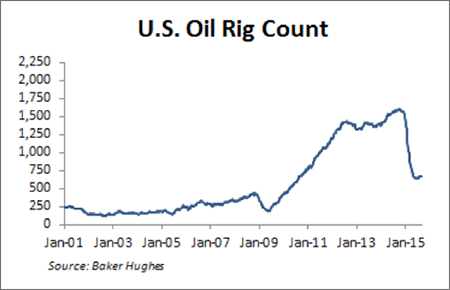
In total, the dollar level of announced cuts is staggering. A recent capital spending survey, conducted by financial services firm Cowen and Company, forecasts a decline of $156 billion in worldwide spending for 2015, over one-third of which is focused on the U.S. These cuts in capital spending have already had a material impact. Over the past year, in the U.S. alone, the rig count declined from 1,584 to 662, a 58% drop-off.
Much of the decline in spending is in shale oil where the time to drill and complete a well is down to three to six months. Future large projects are also impacted. A recent Wood Mackenzie report identified $220 billion of shelved capital spending, primarily in multi-year, large ventures. The report quantified that 46 projects have been put on hold. These initiatives, largely deepwater or ultra-deepwater focused, had the potential to add 20 billion barrels of oil equivalent to reserves, but no longer met the appropriate return requirements in a low-price scenario.
While these cuts to spending are no doubt substantial, it often takes time before the adjusted capital spending across the industry is reflected in production. In fact, oil production growth continued through April 2015, resulting from record levels of upstream investment between 2011 and 2014. Also, advances in productivity significantly increased the initial flowrates achieved in shale plays in the U.S. However, very recent numbers indicate a decline in the domestic supply is under way. According to the Energy Information Agency (EIA), after peaking at 9.6 mbpd, total U.S. supply now stands at 9.3 mbpd and is projected to conclude this year at 8.9 mbpd. For 2016, the EIA forecasts an average of 8.8 mbpd for the year.
Most of the near-term decline comes from the short-cycle shale plays. Production declines relating to spending cuts in the large offshore projects, meanwhile, typically exhibit a time lag of four years or longer between the final investment decisions and resulting production.
Timing of the next upswing in oil is difficult to pin down. That being said, the industry has a substantial history of adjusting spending during down cycles while preparing for growth once demand again outpaces supply. Indeed, the same cost-cutting and capital discipline strategies that proved successful in previous down-cycles have been applied in this cycle and are now beginning to show results. Looking out over the next few years, reduced capital expenditures will have a meaningful impact on the supply of oil available in the marketplace, paving the way for an increase in oil prices. In our view, patient investors will be rewarded just as they have been during past cycles.