October 10, 2017
This year, technology stocks have been the primary driver of returns for the S&P 500 Index. The outperformance of the FANG stocks, in particular, has led many to question if these stocks have run too far, too fast.
The FANG stocks refers to an acronym comprised of Facebook, Amazon, Netflix and Google, four of the most notable market performers over the past couple of years. Goldman Sachs, in June, built upon the acronym to create a larger, expanded version – the FAAMG stocks – that swapped out Netflix with Apple and Microsoft. While analysts may quibble over which names ultimately belong, the fact is that so far this year, the broader domestic stock market has been largely driven by the performance of a few mega-cap technology companies.
The 10 largest S&P 500 stocks have contributed to nearly 30% of the returns in the index so far in 2017. While investors have gravitated to FANG stocks in recent years, concern is growing around the group’s valuation and the risks associated with a market whose fortunes seem to rest on the performance of a few companies. The good news is that the fundamentals for these stocks, for the most part, do indeed support the escalated prices. In addition, although a large percentage of the stock market returns this year are being driven by a handful of companies, historically this is not unusual. Taken together, this should provide investors with a certain level of comfort for the remainder of the year.
Putting the FANG Trade in Context
When looking at the stock-price movements of the FANG stocks throughout the first half of 2017, it is important to consider that the technology sector, as a whole, was coming off of a meaningful selloff at the end of last year relative to the broader market. The S&P 500 rallied by nearly 5.0% in the last two months of 2016, spurred by a sector rotation in which investors locked in gains by selling Technology and moved into Financials and Industrials, which were expected to benefit from deregulation and increased infrastructure spending. The FANG names, in particular, sold off and were down 4.0% on average (and down 9.0% relative to the S&P 500), with Facebook down as much as 7.0% (12.0% on a relative basis) following the U.S. election. This pullback was short-lived, however, as investors jumped back into the FANG stocks early this year and have since been rewarded with an impressive run, except for a brief pause in June.
Strong revenue and earnings gains have been the primary driver of the stock-price appreciation among the FANG names. While their price-to-earnings multiples have expanded in some cases, the moves have not been nearly as large as the headlines might imply. In fact, for Facebook and Google, the majority of the stock-price appreciation (over 90% and 70%, respectively) has been driven by earnings growth, while Netflix’s multiple has actually experienced compression since the start of the year.
Amazon has been the one exception as it relates to the stock’s P/E multiple. Investors have chosen to pay a premium for Amazon due in part to the growth and profitability of its cloud-based AWS (Amazon Web Services) platform, which allows the company to pursue new investments to drive top-line growth, even if it comes at the expense of near-term earnings. However, as a result of the significant amount of free cash flow Amazon generates, investors have been valuing the company using this metric. On this basis, its price-to-free-cash-flow multiple has only increased slightly ahead of its peers. The potential for Amazon to continue to disrupt even more industries through its ongoing expansion into new markets, such as its recent push into the grocery store category, presents meaningful growth opportunities.
Understanding the Risks
While it may feel as though the market is dominated by a few mega-cap technology stocks, if you look back in time, the market has a history of being driven by the companies that are leading the economy. During the dot-com boom, companies such as Cisco, Intel, and Oracle had some of the largest market capitalizations at the time. In the late 1960s and 1970s, companies such as Polaroid, Xerox, Coca-Cola, and General Electric were considered the “it” stocks of the day and were known as the “Nifty Fifty.” Today it is Facebook, Amazon, Netflix, and Google.
In part what makes the FANG stocks so compelling is that investors recognize the digital transformation occurring before their eyes and view these names as among the most likely to capitalize and benefit from the secular trends. At the same time, investors are also increasingly concerned about the concentration of these stocks within the S&P 500.
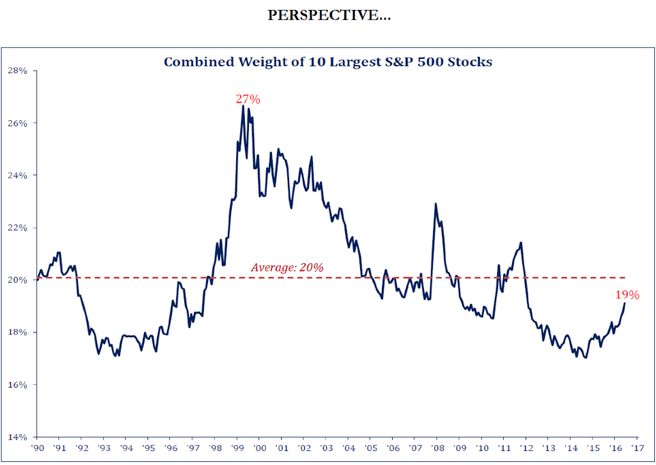
However, market analysts will highlight a notable point of distinction between the largest stocks today and those from past eras. According to Chris Verrone, head of technical analysis at Strategas Research Partners, “The combined weight of the 10 largest stocks in the S&P 500 is only 19%, still below the long-term average (20%) and is not even in the ballpark of what we saw in 1999 (27%).” This is illustrated in the graph below.
The bottom line is that while headlines are touting the lofty valuations of the FANG stocks, the fundamentals support their share-price appreciation. And although this has resulted in S&P 500 returns that are weighted toward these names, the reality is that the stock weightings are in line with historical levels. With history as our guide, it is not at all uncommon for market watchers to focus their attention on the larger growth companies that are disrupting the status quo. This has proven to be the case over time whether it was Coca-Cola in the 1960s or Cisco in the 1990s. Today, the FANG stocks happen to be the ones sharing the spotlight and should continue to do so as long as their fundamentals warrant.